 What does the real estate market look like in Mahoning County for the first quarter of 2013 compared to the first quarter of 2012?
- Pending Sales are UP 10%
- Closed Sales are UP 17%
- Median Sales Prices UP 17%
- Average Sales Prices UP 14%
It is taking less time, on average, to get homes sold . . . down to 120 days from 147 days.
This good activity should continue through the Spring and Summer months, which are traditionally the "busy" months for real estate sales.
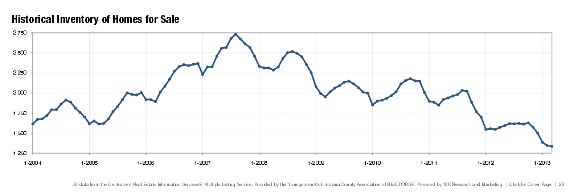
The biggest challenge in the market is the lack of available inventory. There were only 1,334 homes for sale in all of Mahoning County at the end of March, down from 1,546 at the end of March 2012, a 13.7% decrease. This represents only 6.9 months of supply, significantly down (27.3%) from the 9.5 months supply in March of 2012. See the chart below showing historic levels of inventory. You can see that inventory is at the lowest level it's been since charted in 2004..

To read the full Market Indicators Report for Mahoning County click on the attached Monthly Indicators, a research tool provided by the Youngstown Columbiana Association of REALTORS®.
| Attachment | Size |
|---|---|
| columbiana_mahoning_mmi_2013-03.pdf | 6.22 MB |
- Patty Massare's blog
- Login to post comments
 Google+